


How selective is Oxbridge?
Depending on the reference class, between 0.0001% and 100% of applicants could get in

At the time of writing, the Oxbridge (undergraduate) admissions deadline is in a couple of weeks.1 Both universities put a lot of effort into widening participation: spreading the message that Oxbridge is for anyone who can flourish here, no matter their background. But the harsh reality is that most people can’t get in. Basic supply and demand dictates that Oxbridge remains very selective.
But precisely how selective?
(In what follows I am concerned only with undergraduate, not postgraduate, admissions.)
Over the last five years, Oxford has averaged about 3,800 offers per year, and Cambridge about 4,500, making 8,300 Oxbridge offers per year.
How selective this is depends on your reference class. I’ll consider three: (1) actual applicants (ie the admissions rate); (2) potential applicants (ie people of vaguely the right age); and (3) qualified potential applicants (ie people who meet the minimum entrance requirements). Each measure gives a different impression of Oxbridge selectivity.
1. Actual applicants
University selectivity is most commonly measured by admissions rates: the percentage of actual applicants who receive offers.
Between 2019 to 2023, Oxbridge admissions rates have ranged between 15% and 24%:
(Oxford’s rate is lower than Cambridge’s rate both because they receive more applicants and because they offer fewer places.)
By this metric, Oxbridge doesn’t seem exceptionally selective. Several Ivy League universities have admissions rates around 4%, while Harvard’s is just 3.4%.
But admissions rates don’t tell the whole story.
Most importantly, admissions rates are influenced by admissions criteria. Cambridge could halve its admissions rate and suddenly look much more competitive simply by lowering its entrance criteria. It wouldn’t matter if the new applicants were entirely unqualified: hopeless applicants are still applicants. Receiving (and rejecting) their applications would still boost Cambridge’s apparent selectivity, without at all affecting the chances of admission for qualified candidates.
(Anecdotally, something like this happened when colleges started advertising on TikTok, and attracting many new but under-qualified applicants.)
If you pull a random person off the street, then their chance of getting admitted to Oxbridge would be a lot lower than 15%. That’s because people who apply to Oxbridge are extremely self-selecting, guided by the relatively high admissions criteria. Actual applicants are much more likely to get admitted than those who don’t apply, even in the non-tautological sense (ie even if those others did apply).
The next two methods of gauging selectivity both account for this selection effect, albeit in different ways.
2. Potential applicants
Rather than dividing Oxbridge places by the extremely self-selected group of actual applicants, we could divide them by the total number of potential applicants. For example, if there were 830,000 potential applicants for 8,300 places then only 1% could get a place.2 This rate would not be sensitive to the vagaries of how many people actually chose to apply.
How do you define a potential applicant?
Virtually anyone could apply to Oxbridge as an undergraduate.3 If the whole world of 8 billion people was the denominator then we’d get something like a 0.0001% selectivity rate. Even if we limited this to 18 year olds, that’s still something like 130 million people, giving a rate of 0.006%.
Most people globally cannot afford to pay the fees for Oxbridge. It would be too much work to figure out how many people could afford it, so let’s focus on home (British) applicants. British applicants have lower (capped) fees, and can access loans to cover them, making university (in theory) financially accessible to anyone.
If the denominator was all 67 million British people, that would get us a rate of 0.01%. Of course, not many 70-year-olds apply to university. Limiting the denominator to the 750,000 British 18-year-olds, the rate would rise to 1.1%. But while the modal applicant is 18, 18-year-olds make up only 66% of Cambridge applicants and 51% of all university applicants.4 While applicants come from a range of ages, we don’t want to go back to the entire British population. So a reasonable compromise is to double the number of 18-year-olds to account for the scattered applicants of other ages. That gives us 1.5 million people, and halves our selectivity rate to 0.55%.
While I couldn’t produce a sensible global denominator, acknowledging international students can help us tweak the selectivity rate for home students. Both Oxford and Cambridge have about 75% home students and 25% international students.5 (Again, among undergraduates - postgraduates are much more international.) That means that potential British applicants are competing for closer to 6,225 Oxbridge places, cutting the rate to 0.41%
Remember: I’m trying to measure Oxbridge selectivity without limiting my attention solely to actual Oxbridge applicants. That’s why I’m looking for broader denominators. Still, you may think that this is too broad to be useful. After all, a lot of people are simply not interested in any university, let alone Oxbridge. A different denominator, then, is the number of university applicants. This figure also has the benefit of not being limited to British students.
In the 2022 admissions cycle there were 761,740 applicants for all British universities. Assume, unrealistically (but not that unrealistically) that these applicants would all prefer to go to Oxbridge. That gives us a 1.1% selectivity rate for potential applicants.6
In summary, then: for British people of an age who would plausibly apply to university, something like 0.4% could go to Oxbridge. For all applicants to British universities, the rate would be about 1%. This gives us quite a different picture of Oxbridge selectivity as compared with the 15-24% rate of actual Oxbridge applicants.
3. Qualified potential applicants
Merely potential applicants (as defined above) gives us a very large denominator. Most people within those denominators don’t come anywhere near to the Oxbridge admission standards. But actual applicants give us a very small denominator. Plausibly there are many people who would have a shot of admission, but for whatever reason do not apply. (I was one of them.) A middle ground, then, is to count the number of qualified potential applicants: people who meet the minimum entrance requirements, regardless of whether they applied to Oxbridge.7
The higher the minimum entry requirements, the fewer people who will apply, and so the higher will be your admissions rate. This partly explains why Cambridge has a consistently higher admissions rate than Oxford: it tends to have higher minimum entry requirements, and so is selecting from a smaller pool of (on average) higher-qualified applicants.
This also explains why admissions rates can be misleading. As I noted above, Cambridge could plausibly bring its admissions rate down to Harvard levels by dropping its minimum entry requirements and getting a flood of no-hope applicants. But that just wastes everyone’s time. So the minimum entry requirements are intended to be a rough approximation of who seems qualified on paper.
The minimum entry requirement for many subjects is AAA at A level. Conveniently, the Government provides statistics for the number of students achieving AAA or higher. (It is possible to get higher results because there is a rank above A - A* - and because candidates may take more than three A levels).
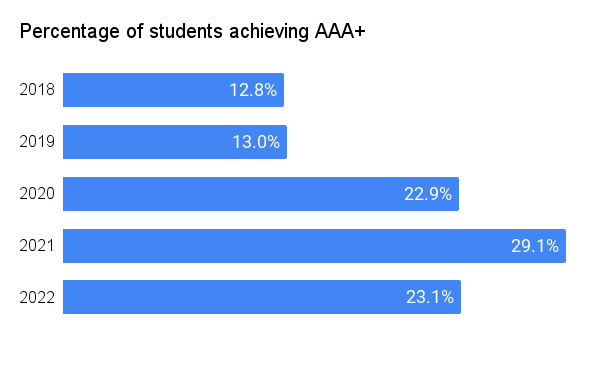
The large uptick from 2020 to 2022 was the result of Covid-19 mitigation.8 Before these special measures, however, around 13% of students met Oxbridge’s minimum AAA requirement.
We can divide the (home-adjusted)9 Oxbridge places by the number of ‘paper qualified’ students to get the ‘qualified potential applicant’ selectivity rate:

That is: before Covid, about 17% of paper qualified applicants could receive an Oxbridge place, while Covid-induced grade inflation dropped this to c. 10%.
In reality, the minimum entry requirements are somewhat higher than this, for three reasons.
First, colleges can make higher-than-normal minimum offers to particular candidates. But this is sufficiently rare that we can leave it aside.
Second, several subjects have higher official requirements, eg maths at Cambridge requires A*A*A. Ideally we’d weight the entrance requirements of each subject by the number of places in that subject, to find a weighted average minimum entry requirement. But the Government data isn’t sufficiently granular to see how many people would actually meet such a threshold, so I haven’t attempted to figure this out.10
Third, the realistic minimum entry requirements may be higher than the stated minimum entry requirements. If a don has 10 applicants achieving AAA for any given place, then it’d be natural for them to start looking for candidates with A*s. This is borne out by Oxford’s statistics, which show that 90% of candidates have at least one A* (which Oxford only requires for some science subjects), 80% have at least two A*s (which, as far as I understand, is not formally required for any Oxford subject), and fully 60% have three or more A*s:

(Caveat: this data is from the Covid-affected 2022 intake, which inflated the A* rate.)
I started writing this post before the 2023 A level results came out, but since then the Government have released an infographic for the number of students achieving A*A*A* this year and previously:

I still can’t find data for more specific achievement thresholds (eg just one or two A*s), but this is still very helpful.
In the non-Covid-affected 2019 and 2023 exams,11 around 3000 and 4000 British students achieved 3 A*s. But there are over 6000 Oxbridge places for British students. So Oxbridge could take every A*A*A* student, with room to spare, for a ~100% admissions rate.
This is not how the system currently works: there is more to a competitive application than merely grades. But, from the look of the Oxford data, we might be heading in that direction.12
Summary
While university selectivity is typically judged on admissions rates, this can be misleading. The reference class of actual applicants doesn’t tell the whole story. Dropping paper standards could result in more applicants and a lower admissions rate, without affecting odds of admission for more qualified applicants. So before judging how selective a university is, it helps to consider several different reference classes.
Oxbridge (could) admit:
0.006% of 18 year olds, globally.
0.4% of British people of roughly University-going age
1.1% of applicants to British universities (home and international)
10% of AAA+ home students (during Covid)
15% of actual applicants (Oxford low watermark, during Covid)
17% of AAA+ students (pre Covid)
24% of actual applicants (Cambridge high watermark, pre Covid)
100% of A*A*A* students
I’m not a fan of the British media’s obsessive focus on Oxbridge to the exclusion of other universities, but they happen to be what I know best, and at any rate it’s easier to analyse two universities rather than 10 or 100.
Only 1 person can date Bill the Monogamous Heterosexual British Troglodyte at any given time, but it would be weird to frame this as the women of Britain having a 1-in-25 million chance of dating Bill, or Bill having a 0.000004% dating admittance rate. This section works with the implicit background assumption that any given applicant would choose Oxbridge over an alternative university. This is not true, but it’s sufficiently true to make the following numbers a useful heuristic.
As far as I know, the only people barred from applying are those who already hold an undergraduate degree from Oxford or Cambridge (and wish to apply to the same university again).
The British share of Oxbridge places is not set by quota, and may well change a lot in the future. Many universities are in dire financial circumstances and rely a lot and having more (higher-paying) international students.
I can’t find Oxford data. Interestingly, the admissions rate doesn’t noticeably vary as between different age groups.
From the total number of applicants, 611,900 were home students, which gives us a 1% selectivity rate with a 75%-home-student numerator. 149,840 were international students, which gives us a 1.4% selectivity rate with our 25%-international-student numerator.
Oxbridge also does admissions interviews. The more people who meet the minimum paper requirements, the more potent will be interviews as a filtering mechanism. But there’s no way to get data on who is ‘interview-qualified’, so I leave this aside.
In 2020, A levels were awarded based on predicted rather than examined grades, and after that various mitigation measures were introduced to account for disrupted schooling.
Ie 0.75x.
The Government does translate A level results into an numerical ‘Average Point Score’, and provides a wealth of data on average APS by various different metrics (school type, gender, etc.) But, as far as I can tell, it doesn’t provide a detailed breakdown of APS scores to allow one to generate the number of candidates achieving any arbitrary threshold. Interested researchers might be able to apply to get that data, but I didn’t bother just for this post.
Exams were sat in 2022, unlike 2020 and 2021, but marking was deliberately lenient to account for disrupted schooling.
In the endless ‘Should Oxbridge do interviews?’ discussions, one pro-interview talking point is that we simply cannot feasibly filter students by paper results alone. But it turns out that ‘Just admit those with A*A*A*’ would actually be too strong a filter. A different problem is that we mostly don’t admit based on grades, but rather on predicted grades. But that’s a discussion for another time.